You're running fewer orders or bookings year to date than usual. You check your analytics dashboard: traffic looks comparable, conversion rate might be slightly down, but your campaigns seem to be doing what they've always done. So you throw more budget at the running campaigns to close the revenue gap, right?
What you might be missing: the shortfall isn't an acquisition problem. It's retention. And it's something that would have been easier to fix in the past than it is today.
Acquiring new customers costs more than keeping existing ones. But how do you actually know whether your retention is any good? And if it isn't, why not?
More than once I've seen businesses panic and rush to increase budgets and chase new customers, when the answer could have been simpler.
What your report tells you, and what it doesn't
Most tools I've come across show you a snapshot. You look at the past week, month or day and see what happened. Sessions, conversions, revenue across different periods. Useful for steering, but in most cases it won't tell you why customers who came to you last year aren't coming back this year.
GA4 has a cohort report, but it's limited and rarely used correctly. And even the standard metrics you do pull from it deserve a critical look. What happens in practice: businesses look at the overall picture, see a decline, and look for the cause in the current year. They optimise campaigns, improve landing pages, test new channels. While the real cause emerged much earlier.
Repeat share versus repeat rate: a difference with enormous consequences
I want to pause here, because this is a mistake I've encountered more often than you'd think. Even at businesses that believe they're tracking retention well.
Repeat share is the proportion of your orders or bookings that comes from returning customers today. If 35% of your bookings this year come from repeaters, that sounds like a healthy sign of loyalty.
But repeat share only tells you about the composition of your current bookings. Not about how loyal your customers actually are. That number means you're 35% dependent on repeat orders. Not that 35% of your customers come back.
Say you acquired fewer new customers. The total drops, but the number of repeat orders stays the same. Your repeat share rises, while your retention has actually stayed flat or worsened. The conclusion you draw: customers are becoming more loyal. The reality: you simply attracted fewer new ones.
Repeat rate is the number that matters more. Of all customers you've acquired, how many ever came back? That's about the quality of an acquisition period. Not about the composition of your current revenue.
I've noticed it at several clients: they were looking at the first number instead of the second. In one case, a cohort analysis revealed that the repeat rate of the most recent two acquisition years was markedly lower than earlier cohorts. The customers weren't necessarily less satisfied. The cause lay elsewhere. That pattern had remained invisible for years. Everyone was looking at repeat share. The conclusion was always: "things are fine, more than a third of our bookings come from returning customers." Everyone was unconsciously ignoring cohorts and looking at other signals for repeat orders.
"Repeat share tells you how dependent your revenue is on repeat orders today. Repeat rate tells you how well you've reactivated your new customers."
What that difference means for your acquisition budget I describe in the article on CLTV and ROAS targets.
What a cohort analysis reveals
A cohort is a group of customers acquired in the same period, typically the same year or season. Track those groups separately in the years that follow, and you see something that disappears completely in aggregate numbers.
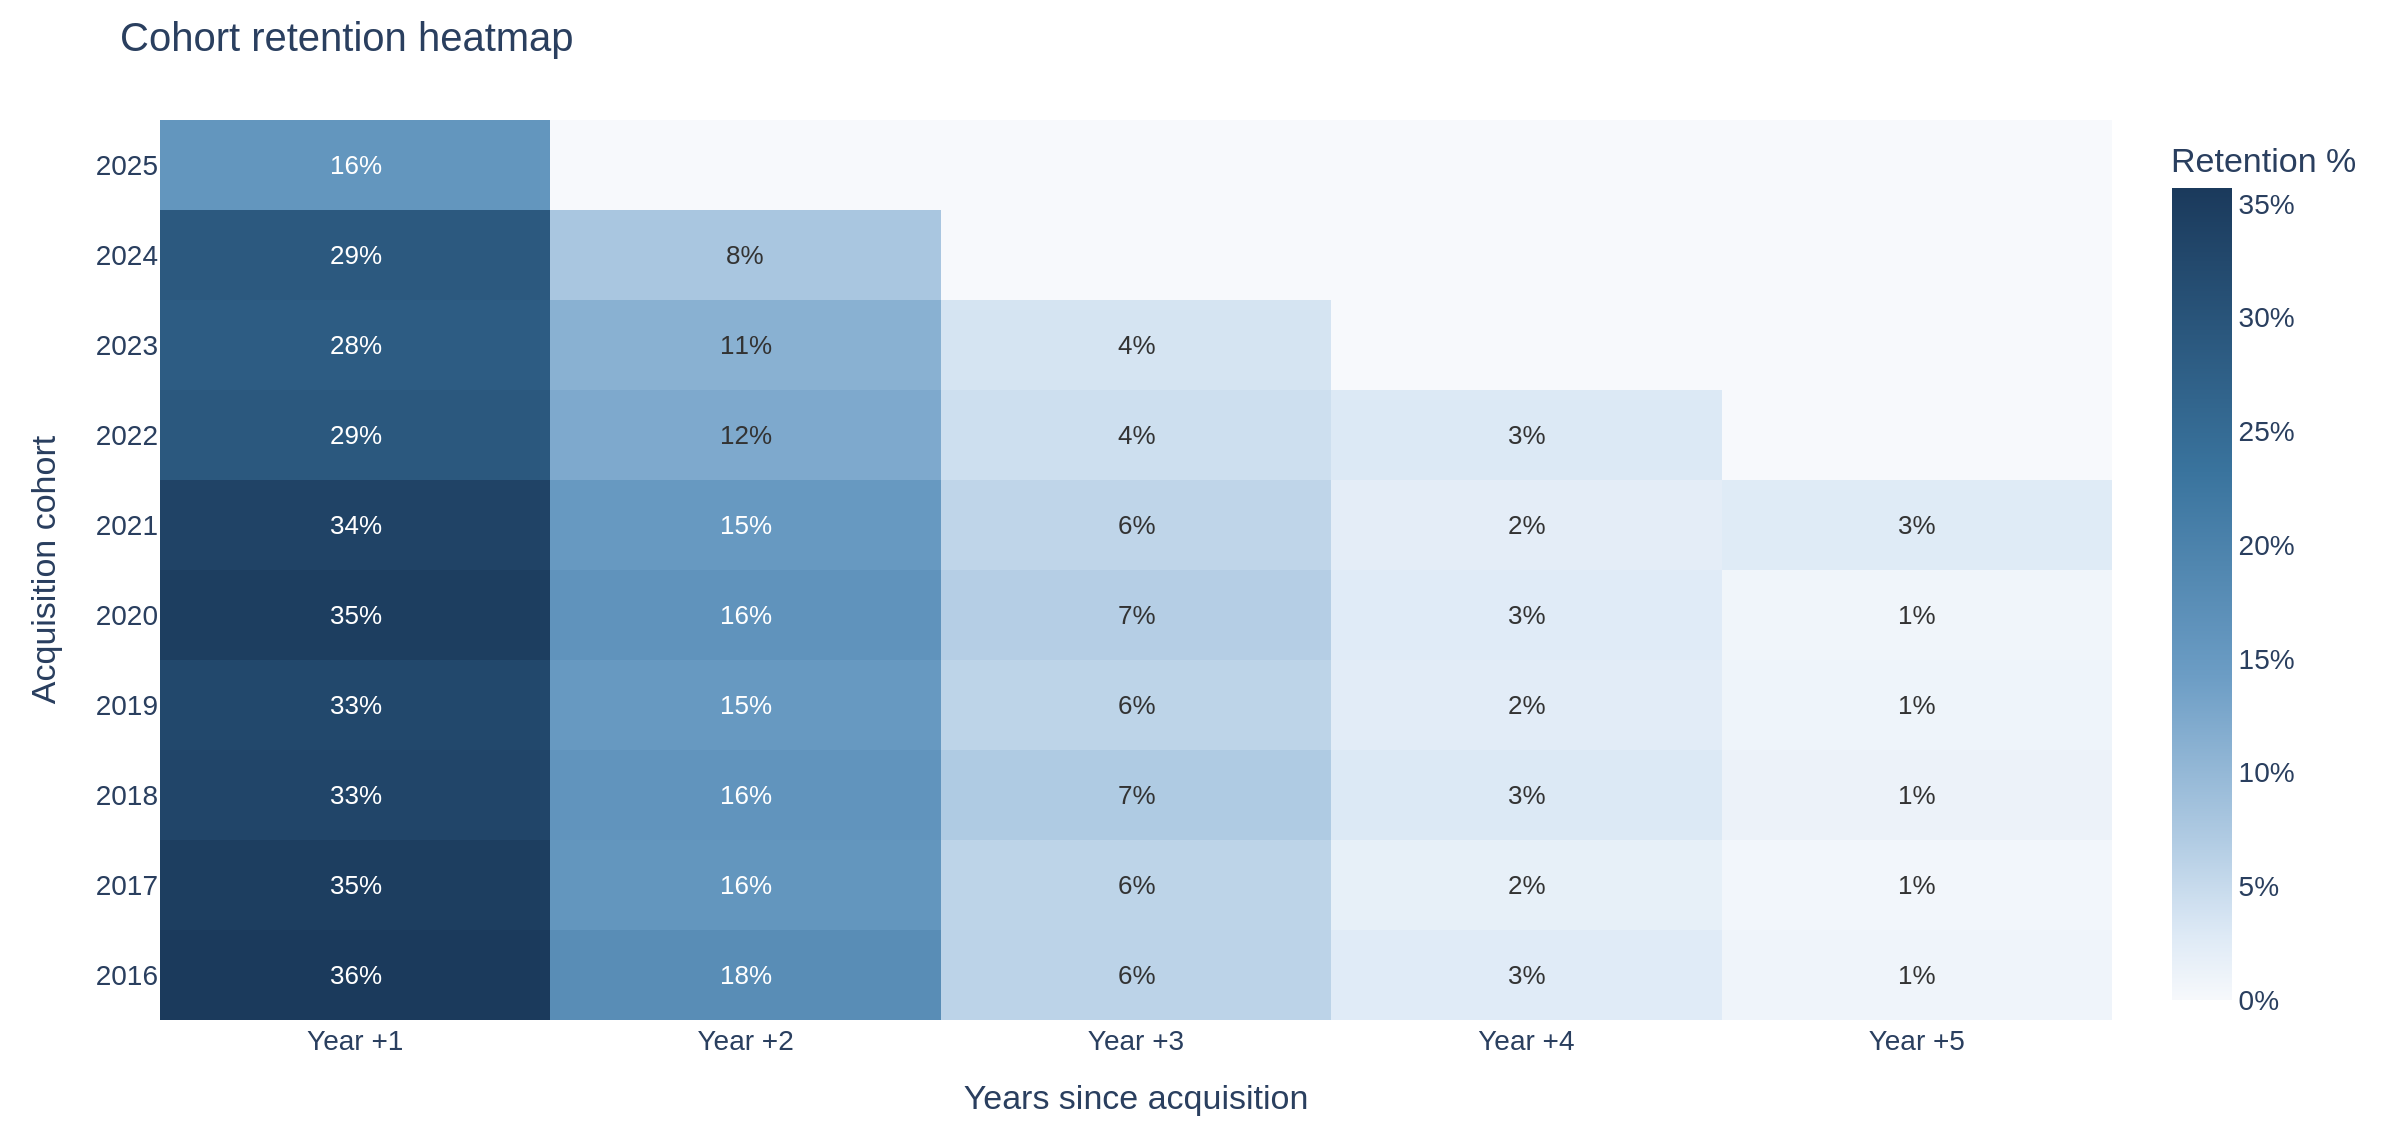
At the business I'm writing about, the retention heatmap looked like this: customers acquired in 2018 and 2019 came back at a rate of around 25%. Customers acquired in 2022 and 2023 were at 18 to 19% after one year. Not dramatically lower, but consistent. And it wasn't coincidence.
Please don't rely on a GA4 cohort for this, it won't be reliable. Try to pull this from the business data itself. Look at your customers, when they first ordered, and how often they ordered again.
The same pattern is visible in the demo dataset, with full follow-up data across multiple years. The absolute numbers differ from the case above, but the gradient is identical: earlier cohorts retain noticeably better than recent ones, and retention erodes further with every passing year.
The question was: what's different about those more recent cohorts? The strategy looked the same as every other year, but the market had also become more competitive.
What I found at this business
At another business I worked with, there's a loyalty promotion that encourages customers to book their next stay at checkout. In seasons where the promotion was used well, the median time between checkout and rebooking was short. In the season where pricing was available late, the promotion was used far less and the median rebooking time was considerably higher.
The hypothesis that followed: returning customers were ready to book, but couldn't. They were standing with their wallets open, but the prices weren't there yet. Every moment you make this group wait is a chance they churn.
That loss only shows up in your retention numbers a year later. By then it's too late.
That's what the data from my dashboards showed at this specific business. Whether the same mechanism applies to your business depends on your product, your purchase cycle, and whether there's a moment where your customer is ready to buy again and you're not there. The question is universal. The answer is not.
"Your most loyal customers don't necessarily leave after a bad experience. More often, you simply missed the moment to reactivate them."
Every business has a purchase cycle
The example above is from hospitality, where the annual cycle is clearly visible in booking data. But the same question applies to any business with returning customers.
A B2B service provider whose clients renew annually. An accounting firm in spring. A garden centre that knows customers return every March. The core question is always the same: do you know when your customer is ready to buy again? And are you there at that moment?
In other sectors you have to reconstruct that purchase cycle yourself from purchase history. But once you know it, you know when you need to be available and visible.
Three questions every business should be able to answer
You don't need a complex dashboard system for this. Three questions are enough.
- What is the purchase cycle of your repeat customers, and what is their lifetime? Once you know this, you know how to define your acquisition periods. In this article we talk about acquisition years, but for another business it might be acquisition weeks.
- What is the repeat rate per acquisition period? Not today's repeat share, but the percentage of customers acquired in period X who ever came back. If that percentage is declining, it could still be seasonal. Look at it across multiple years for a clearer picture.
- When do returning customers reach your purchase page? Make sure an existing customer can make a repeat purchase immediately.
What else you can see when the data is there
The core of this story is the difference between repeat share and repeat rate. The timing mechanism is what I found at one specific business. But a full cohort analysis delivers a range of other insights.
At another business I work with, I looked at which type of product creates the most loyalty. Not every product attracts equally loyal customers, and that has consequences for how you structure marketing and pricing. It also stood out how the time between purchases evolves as a customer returns more often, and whether more recent cohorts show a different return rhythm. Analysing churn by season also became possible: recurring, or tied to specific years? And for businesses with multiple locations or product lines, you could compare repeat rate by category to see where the strongest loyalty is created. You want the highest possible customer value per customer, right?
Each of those insights starts from the same question: of the customers you've acquired, how many came back, when, and why or why not.
In a follow-up article I go deeper into how you measure that purchase cycle precisely, which signals point to imminent churn, and how you turn that into action at the right moment.
If your orders or bookings are down this year, don't jump straight to acquisition or campaigns. Start with the basic question: are there fewer acquisitions or fewer repeats than expected? Or both? Look not just at the proportion but at the absolute number of repeaters. If that number is falling while your total stays flat or grows, you have a retention problem.
Only then does it make sense to ask which acquisition period is underperforming in repeat rate, and what happened at the moment those customers were ready to come back. There are enough ways to identify which customers had more potential to repeat, and ways to activate them. Sometimes reactivation doesn't make sense either. I've also worked with a business that sells wood-burning stoves. They don't expect a repeat purchase for at least 20 years. But that's another story.