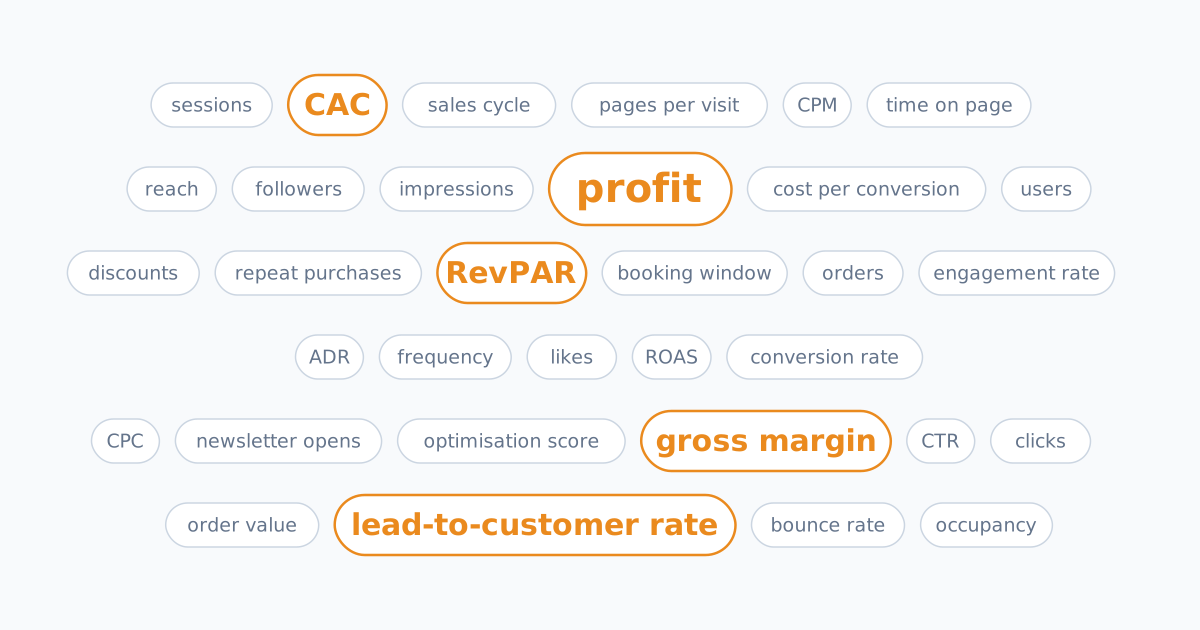
KPI stands for key performance indicator. It's a number you choose to track whether you're reaching your goal. Of all the numbers you can measure, KPIs are the few that say something about how your business is doing.
At the bottom you'll find three questions to test yourself.
What does KPI mean?
Put simply, it's the performance indicator that matters most. That's what the word "key" is there for. A business can measure hundreds of things, but you can only steer on a few at once. Those few are your KPIs.
KPI vs metric: what's the difference?
A metric is anything you can measure: impressions, clicks, visitors, time on page, followers. Google Ads and GA4 give you hundreds of them together. A KPI is a metric you steer by: when it goes up or down, you make a decision.
So the difference is in what you do with it. When your revenue drops sharply, you act straight away. When the growth in your number of likes slows down, you probably don't. The first is a KPI, the second a metric, and that belongs in your report as background at most.
An example, with fictional figures based on a real case. An online shop focuses on conversion rate, and sees it go up too. Revenue per session rises with it, and the average order value a little as well. On those numbers alone, everything seems to be moving in the right direction.
| Quarter | Sessions | Conversion rate | Order value | Revenue per session | Orders | Revenue |
|---|---|---|---|---|---|---|
| Q1 | 40,000 | 2.2% | €64 | €1.41 | 880 | €56,320 |
| Q2 | 36,000 | 2.4% | €64 | €1.54 | 864 | €55,296 |
| Q3 | 30,000 | 2.6% | €65 | €1.69 | 780 | €50,700 |
| Q4 | 22,000 | 3.2% | €66 | €2.11 | 704 | €46,464 |
Fictional figures, based on a real case.
But the number of sessions almost halves. As a result, fewer orders come in, and so less revenue. In the fourth quarter, revenue per session is half as high again as in the first, with 45% fewer sessions. A 50% rise doesn't make up for a 45% drop: 55% of the sessions at one and a half times the revenue per session is 82.5% of what you had. Together, that means just over 17% less revenue.
With revenue as your KPI, you see the problem straight away. The metrics show where it is: in the number of visitors. I already wrote a piece on misreading conversion rate.
Which numbers are KPIs for you depends on your goal. The number of visitors can be a KPI for one business and just context for another.
From goal to KPI
Google Analytics can be overwhelming. You have so many different metrics to look at, and the most common one is traffic, because that's the easiest to measure. In almost every table you end up looking at either users or sessions. But traffic in itself isn't a goal.
Turn it around and start from your goal. What do you want to achieve? More profit, or full occupancy in the low season? Then find the number that's closest to that goal. That's your KPI.
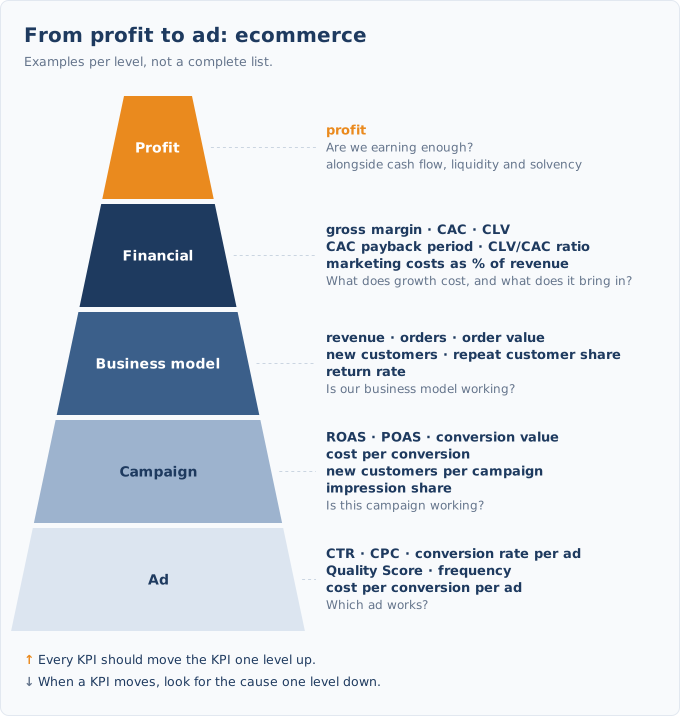
For every commercial business, profit ends up at the top. Revenue or leads without profit isn't something anyone keeps up for long. For the business as a whole, cash flow, liquidity and solvency sit right next to it. Marketing touches those through your CAC payback period, among other things, explained further down under ecommerce.
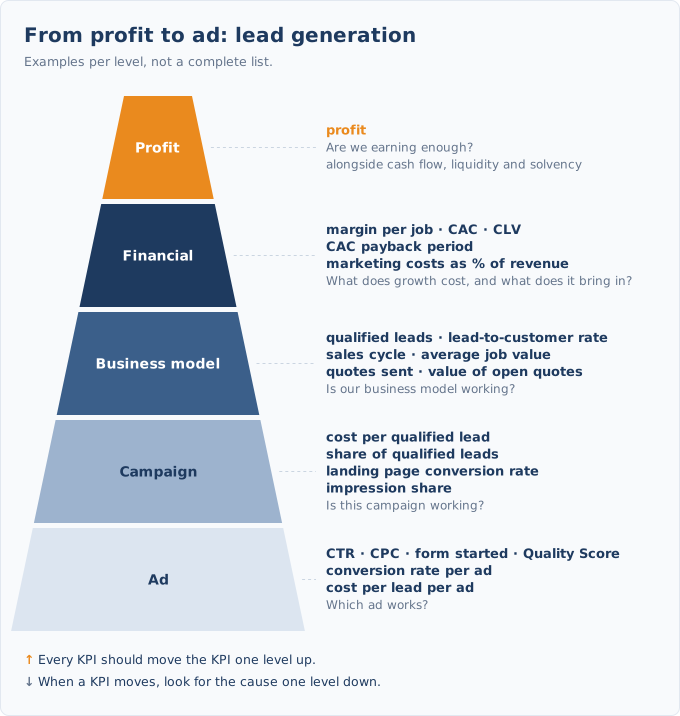
Every KPI can be unfolded into the metrics that explain it. One level down, those metrics are KPIs themselves, with their own metrics under the bonnet. You keep going until you reach something you can change directly, such as a bid or a price. One metric can sit under more than one KPI. Conversion rate drives both what a new customer costs and how many orders you get.
That gives you five levels. Profit is at the top. Below it are the financial KPIs, such as your gross margin and what a new customer costs. Then the KPIs of your business model: orders for an online shop, qualified leads for a business that works with enquiries, RevPAR for an accommodation. Below that sit your campaigns, and under each campaign your ads. Further on in this article there's a pyramid with those five levels for each type of business.
What's a metric for the business owner can be exactly the number the person running the campaign steers by. For the business, conversion rate is a metric under the cost per new customer. For a Google Ads campaign, conversion value or cost per conversion is the KPI. If you're testing a new landing page, even bounce rate can be the number you steer by for a while. Keep in mind that the conversion value in Google Ads isn't the same as the revenue in your accounts.
One rule applies at every level. A KPI should move the KPI one level up. If your campaign KPI goes up while your business KPI goes down, you're steering by the wrong number. That's what happened with conversion rate in the online shop example.
You check your different KPIs on your dashboard every week or every day. When you notice one of them isn't keeping up with the target you had in mind, it's time to lift the bonnet and look at the metrics that feed into each KPI.
Leading and lagging indicators
Some KPIs show a problem early, others only once it's been there for a while.
Revenue is a lagging KPI. By the time your revenue drops, the problem has been going on for weeks or months. The number of quote requests or the number of new bookings for next season are leading KPIs: they move first, and your revenue follows later. The higher a KPI sits in the five levels, the later it moves. You only know your profit once everything has already happened.
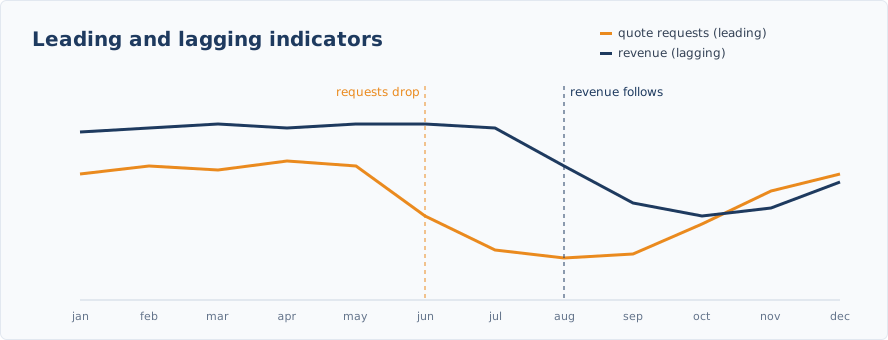
You need both. The lagging ones tell you whether you've reached your goal. The leading ones give you time to adjust before it's too late.
KPI examples by type of business
Which KPIs you choose depends on how your business makes money. Below are the most important marketing KPIs, with the formula. Each type of business has a pyramid showing how the KPIs connect, from profit down to the ad.
Ecommerce KPIs
CAC (customer acquisition cost)
What you spend on marketing, on average, to win one new customer.
CAC = marketing costs ÷ number of new customers
Example: you spend €3,000 on ads in a month and you get 75 new customers. Then a new customer costs you €40. Whether that's a lot depends on what that customer brings in over the years, the CLV (customer lifetime value). More on that in the article on customer lifetime value.
Metrics that explain it: CPC and conversion rate.
CAC payback period
How long it takes for a new customer to pay back what it cost to win them.
CAC payback period = CAC ÷ gross margin per customer per month
Example: a new customer costs you €40 and brings in €8 of gross margin a month on average. Then you've got that €40 back after five months. Until then, that money is tied up. The longer that period, the less marketing you can pay for up front without your cash flow suffering.
Metrics that explain it: CAC, gross margin and how often a customer buys again.
Gross margin
What's left of your revenue after buying in your products.
Gross margin = (revenue − cost of goods) ÷ revenue × 100
Revenue alone says little. An online shop that sells 20% more by discounting everything can earn less than last year.
Metrics that explain it: discounts, purchase price and the mix of products that sell.
Repeat customer share
What share of your sales comes from people who bought from you before.
Repeat customer share = orders from existing customers ÷ total orders × 100
A bigger share can be good news, because existing customers who buy again cost you less. Unless it rises because fewer new customers are coming in. That's why you're best off looking at the share and the number of new customers together.
Metrics that explain it: repeat rate, number of repeat purchases and the time to the next order.
Every term from this pyramid explained in the glossary
Lead generation KPIs
If you work with quotes or enquiries, you probably don't sell directly on your website. Then it's tempting to make the number of leads your KPI. But a lead isn't a customer yet, and ten bad leads cost you more (time) than one good one.
Cost per qualified lead
What you pay, on average, for an enquiry that fits you. The standard CPL (cost per lead) counts every enquiry, including the ones that don't fit.
Cost per qualified lead = marketing costs ÷ number of qualified leads
If you send every enquiry to Google or Meta as a conversion, your campaign also learns to bring in people who don't fit. Both platforms let you report back afterwards which enquiries did fit, so the campaign can steer on those.
Metrics that explain it: CPC, conversion rate of your landing page and the share of enquiries that fit you.
Lead-to-customer rate
What share of those enquiries signs.
Lead-to-customer rate = number of new customers ÷ number of qualified leads × 100
Metrics that explain it: how fast you respond to an enquiry, the number of quotes you send and the channel the lead comes from.
Sales cycle
How long it takes from first contact to a signed job.
Sales cycle = average number of days between first contact and signed job
That also decides when you can judge a campaign: if it takes you six weeks on average to win a client, a two-week campaign tells you nothing yet.
Metrics that explain it: the number of touchpoints before a job and the time between enquiry and quote.
The CAC payback period counts here too. With a long sales cycle, you sometimes pay the marketing for a client months before they sign.
Every term from this pyramid explained in the glossary
Hospitality KPIs
For an accommodation or a hotel, everything revolves around nights.
Occupancy rate
What share of your available nights is booked.
Occupancy rate = booked nights ÷ available nights × 100
Metrics that explain it: number of bookings, average length of stay and cancellations.
ADR (average daily rate)
The average price you get per booked night.
ADR = revenue from stays ÷ booked nights
Together with occupancy, this tells you whether you're full because people want you, or because you're too cheap.
Metrics that explain it: discounts, seasonal pricing and the mix of accommodation types that get booked.
RevPAR (revenue per available room)
Revenue per available night. This number brings occupancy and price together in one figure.
RevPAR = revenue from stays ÷ available nights = ADR × occupancy rate (as a decimal)
A park that's 95% full at €80 a night makes €76 per available night. A park that's 85% full at €100 makes €85.
Metrics that explain it: occupancy rate and ADR.
An example, with fictional figures based on a real case. A network of accommodations grows from 10 to 17 locations in one year.
| Available nights | Occupancy | ADR | Revenue | RevPAR | |
|---|---|---|---|---|---|
| Network 2025 (10 locations) | 6,000 | 42% | €160 | €403,200 | €67.20 |
| Network 2026 (17 locations) | 11,000 | 40% | €140 | €616,500 | €56.05 |
| of which the 10 existing | 6,000 | 36% | €150 | €324,000 | €54.00 |
| of which the 7 new | 5,000 | 45% | €130 | €292,500 | €58.50 |
Fictional figures, based on a real case.
Revenue goes up by 53%. RevPAR goes down by 17%. Both numbers are right, and each tells you something different.
On the RevPAR of the whole network alone, the expansion looks like a bad idea. Split the numbers and the problem turns out to be somewhere else. The 7 new locations make €58.50 per available night. The 10 existing ones drop to €54, because they're less full (36% compared with 42% last year) and sell for less (€150 compared with €160 last year). The new locations make more per night than the existing ones, so they don't drag this year's average down. Though they did take part of their bookings from the existing locations.
In the real case, one existing location lost a large part of its bookings when new locations opened in the same region.
So one KPI never tells you the whole story. Revenue says the network is growing, RevPAR says each night brings in less. Only when you read them together and split the numbers do you see where the problem is.
Booking window
How far ahead people book.
Booking window = average number of days between booking date and arrival date
It's a leading indicator, best compared with your own previous years. If you're behind last year in March for summer arrivals, you want to understand why. Compare your bookings for this season so far with the same date last year, or with the average of the last few years. Those previous years also tell you what share of summer bookings is usually in by March, so as long as people book as early as usual, you can estimate where your season will end. If the booking window of your recent bookings is shorter than last year, people are booking later and you can still catch up. If the window stays the same, fewer people are booking.
Metrics that explain it: the number of new bookings per week and the share of bookings that come in shortly before arrival.
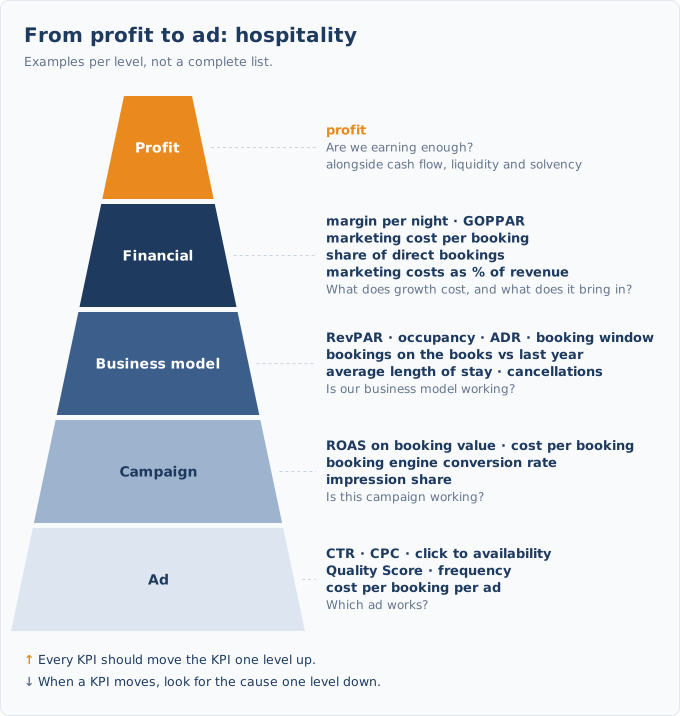
Every term from this pyramid explained in the glossary
KPIs by campaign type
The pyramids above show campaigns that have to deliver something straight away, such as a sale or an enquiry. Not every campaign has that goal. Even then, you should be able to say which business KPI it moves forward.
- Awareness campaigns (for example video or social). KPI: reach and frequency within your audience. Linked to: more searches for your brand name and more direct traffic in the weeks after. Here reach is the KPI, because the campaign isn't meant to sell straight away.
- Remarketing. KPI: ROAS or cost per conversion. Linked to: revenue from returning customers. Remarketing can get the credit for purchases that would have happened without the ad anyway.
- Email and newsletter. KPI: revenue or enquiries per email sent. Linked to: repeat customer share.
Vanity metrics: numbers that look good and say little
Some numbers look impressive in a report but tell you almost nothing about your business. They're called vanity metrics.
- Reach and impressions. How often your ad was shown. An impression doesn't tell you whether someone saw your ad, let alone bought anything. It can help you judge whether your audience is big enough.
- CTR. The percentage of people who click on your ad. A high click-through rate can come from curious people who never buy. It can help you judge whether your ads appeal enough.
- Followers and likes. They say something about your reach on social media, but little about your sales. Lots of followers and likes on your pages who never interact with your posts can be worse for your organic social reach than a few followers who do interact often.
- The optimisation score in Google Ads and the opportunity score in Meta. They measure how closely you follow the platform's own recommendations. According to Google and Meta, that can bring costs down, but following every suggestion can also cost you more.
These numbers are useful for adjusting a campaign. As a KPI for your business they're dangerous, because each of them can look better while your revenue falls. I wrote more about this in the piece on how to check your agency's marketing report.
How to set KPIs
- Write down your goal in one sentence. "More profit from the online shop." "Full occupancy in the low season." If you can't do it in one sentence, you have more than one goal.
- Find the number that's closest to that goal. That's your main KPI.
- Add a few at most that explain that first number or warn you about it. At least one of them should be leading.
- Give every KPI a target and a comparison. See below.
- Agree who acts on it. A KPI nobody responds to is just a metric again.
A good KPI target is SMART: specific, measurable, achievable, relevant and time-bound. For example: "Cost per new customer for the online shop drops from €42 to €35 by the end of March."
- Specific: you know exactly which number has to move, and in which direction.
- Measurable: it's in euros, and you can read it off your dashboard every week.
- Achievable: last year it was €31, so €35 has been done before.
- Relevant: your goal is more profit, and a cheaper customer leaves more profit.
- Time-bound: by the end of March. That's when you know whether it worked.
KPI dashboard: always with a target and a comparison
"A new customer costs us €42." Is that good or bad? You don't know. It only means something when you put something next to it: the target you set yourself, and the same number from last year or last month.
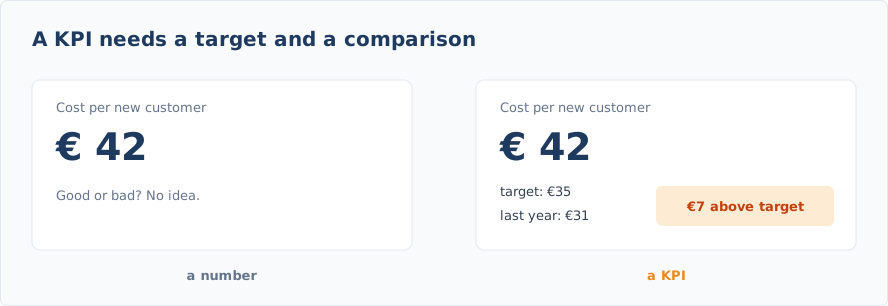
Then put them together in one place. A KPI dashboard shows the same handful of numbers every week, on your own data, with the target and the comparison next to them. Then you no longer have to go looking in five different tools. I build dashboards like that for clients too.
How many KPIs do you need?
More than one per goal, but not ten. With twenty KPIs you're steering on nothing in particular. That's about steering. Measuring you do as broadly as you can, because those are the metrics you need when a KPI moves and you lift the bonnet. The more you measure, the more you know.
Summary
- A KPI is a number you steer by. Everything you can measure but don't do anything with is a metric.
- Start from your goal. The numbers you happen to have come after that.
- For a commercial business, profit is at the top. Every KPI at a lower level should move the KPI above it, and every metric can be a KPI one level down.
- Combine leading KPIs (which give you time) with lagging ones (which tell you whether it worked).
- A KPI always needs a target and a comparison.
- More than one KPI per goal, but not ten.
Test yourself
1. An online shop looks at the number of visitors every week. Revenue is falling, but visitors are going up. Is "visitors" a good KPI here?
No. The number goes up while the goal (revenue, or better: profit) gets worse. Visitors are a metric here that at most explains what's happening at the top of the funnel.
2. A holiday park reaches 95% occupancy in August. Is that good news?
You don't know without a comparison and without the ADR, the average price per night. If last year was 98%, or if that 95% was only reached with heavy discounts, it's less good than it sounds.
3. A business that works with quotes has seen the number of requests fall for two months. Revenue is still stable. Should it act now?
Yes. Requests are a leading KPI. If the sales cycle from request to job is two months, you'll see that drop in revenue soon.
Not sure which numbers matter for your business? Send me a message.